
Making use of the public election poll data from Real Clear Politics, I ran a simple predictive model based on historical poll records and election results. Basic bootstrap resampling was used to simulate the model for 10000 times.
Data Preparation*
The data was obtained from the Real Clear Politics, which collates election poll data in the U.S. The historical data of each election poll is stored in an xml format at the url "http://charts.realclearpolitics.com/charts/%i.xml" where i is the id of the election. For example, the Virginia Governor election poll data is stored at this url. Studying the structure of the xml file, we can pull in the data and put into a Pandas DataFrame.
"""
    Function
    --------
    get_poll_xml
    Given a poll_id, return the XML data as a text string
"""
def get_poll_xml(poll_id):
    url = "http://charts.realclearpolitics.com/charts/%i.xml" % int(poll_id)
    return requests.get(url).text
"""
    Function
    ---------
    rcp_poll_data
    Extract poll information from an XML string, and convert to a DataFrame
    Parameters
    ----------
    xml : str
        A string, containing the XML data from a page like
        get_poll_xml(1044)
    Returns
    -------
    A pandas DataFrame with the following columns:
        date: The date for each entry
        title_n: The data value for the gid=n graph (take the column name
        from the `title` tag)
"""
import xml.etree.ElementTree as ET

def rcp_poll_data(input):
    tree = ET.fromstring(input)
    dictionary = dict()

    dates = list()
    series = tree.findall('series')
    for value in series[0].findall('value'):
        dates.append(value.text)
    dictionary['date'] = pd.to_datetime(dates)

    graphs = tree.findall('graphs/graph')
    for graph in graphs:
            values = list()
            title = graph.get('title')
            for value in graph.findall('value'):
                try:
                    values.append(float(str(value.text)))
                except:
                    values.append(value.text)
            dictionary[title] = values

    df = pd.DataFrame(dictionary)
    df_clean = df.dropna()
    return df_clean
For each election run, we also need to obtain the actual election results to have an overall view of how closed the election poll data was to the actual records. The actual result is stored in a url with a form of "http://www.realclearpolitics.com/epolls/[YEAR]/governor/[STATE]/[TITLE]-[ID].html". The [ID] is the same as the poll_id above. Firstly, get the url list of all the election polls available on Real Clear Politics. For this task, I piloted into the 2010 Governor Races.
"""
    Function
    --------
    find_governor_races

    Find and return links to RCP races on a page like
    http://www.realclearpolitics.com/epolls/2010/governor/
                                        2010_elections_governor_map.html
    Parameters
    ----------
    html : str
        The HTML content of a page to scan
    Returns
    -------
    A list of urls for Governor race pages
"""
import re

def find_governor_races(url):
    text = requests.get(url).text
    links = re.findall('http://www.realclearpolitics.com/epolls/\d{4}/
            governor/\D{2}/.*?-\d{,4}.html',text)
    links = list(set(links))
    return links
For each of the url of 2010 governor races obtained above, I do web scraping to obtain the actual results by inspecting the html of the page, using BeautifulSoup library to get the relevant information, and returning the election results in the form of a dictionary.
"""
    Function
    --------
    race_result
    Return the actual voting results on a race page
    Parameters
    ----------
    url : string
        The website to search through
    Returns
    -------
    A dictionary whose keys are candidate names,
    and whose values is the percentage of votes they received.
"""

from bs4 import BeautifulSoup

def race_result(url):
    page = requests.get(url).text
    soup = BeautifulSoup(page, 'html.parser')
    tables = soup.findAll('table', {'class': 'data'})
    table = tables[0]
    rows = [row for row in table.find_all("tr")]
    columns = [str(col.get_text()) for col in rows[0].find_all("th")]
    candidates = [column.split('(')[0].strip() for column in columns[3:-1]]

    row = rows[1]
    tds = row.find_all("td")
    results = [float(str(t.get_text())) for t in tds[3:-1]]
    # convert to percentage
    tot = sum(results)/100

    return {l:r / tot for l, r in zip(candidates, results)}
Data Visualization*
After obtaining the related data, it is an important step to have a general sense about the data, what it represents, and what insights we can further derive from it. I used matplotlib, a powerful Python library for effective visualization.
import re

"""
This function removes non-letter characters from a word
"""
def _strip(s):
    return re.sub(r'[\W_]+', '', s)

"""
Given an XML document from Real Clear Politics, returns a python dictionary
that maps a graph title to a graph color.
"""
def plot_colors(xml):
    dom = web.Element(xml)
    result = {}
    for graph in dom.by_tag('graph'):
        title = _strip(graph.attributes['title'])
        result[title] = graph.attributes['color']
    return result
"""
    Make a plot of an RCP Poll over time
    Parameters
    ----------
    poll_id : int
        An RCP poll identifier
"""
def poll_plot(poll_id):
    xml = get_poll_xml(poll_id)
    data = rcp_poll_data(xml)
    colors = plot_colors(xml)
    data = data.rename(columns = {c: _strip(c) for c in data.columns})

    #normalize poll numbers so they add to 100%
    norm = data[colors.keys()].sum(axis=1) / 100
    for c in colors.keys():
        data[c] /= norm

    for label, color in colors.items():
        plt.plot(data.date, data[label], color=color, label=label)

    plt.xticks(rotation=70)
    plt.legend(loc='best')
    plt.xlabel("Date")
    plt.ylabel("Normalized Poll Percentage")
For example, the election poll data of California Governor Race between Whitman vs. Brown is plotted below:
poll_plot(1113)

Now we can combine the above plot with the corresponding actual election results. I visualized this for all the governor races in 2010 (only part of the visualization is shown below).
def id_from_url(url):
    """Given a URL, look up the RCP identifier number"""
    return url.split('-')[-1].split('.html')[0]

def plot_race(url):
    """Make a plot summarizing the historical poll data and the actual results
    """
    id = id_from_url(url)
    xml = get_poll_xml(id)
    colors = plot_colors(xml)
    if len(colors) == 0:
        return
    result = race_result(url)
    poll_plot(id)
    plt.xlabel("Date")
    plt.ylabel("Polling Percentage")
    for r in result:
        plt.axhline(result[r], color=colors[_strip(r)], alpha=0.6, ls='--')
url = 'http://www.realclearpolitics.com/epolls/2010/governor/2010_elections_governor_map.html'
for race in find_governor_races(url):
    plot_race(race)
    plt.show()


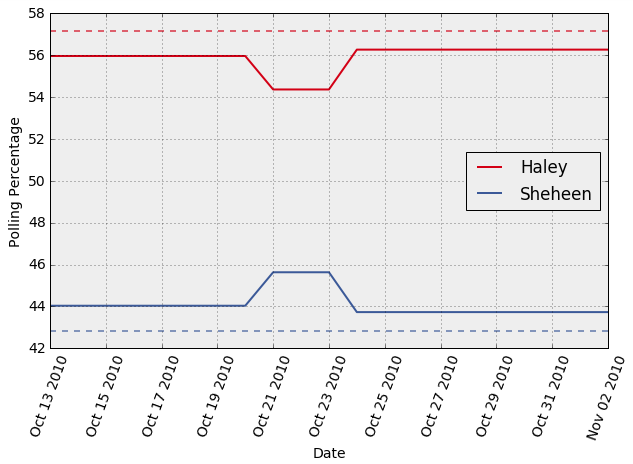
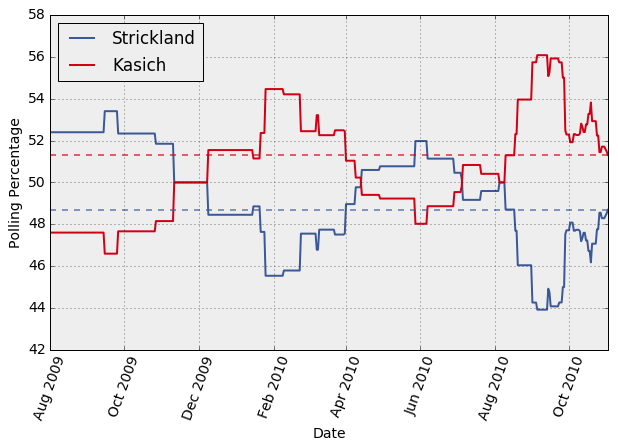

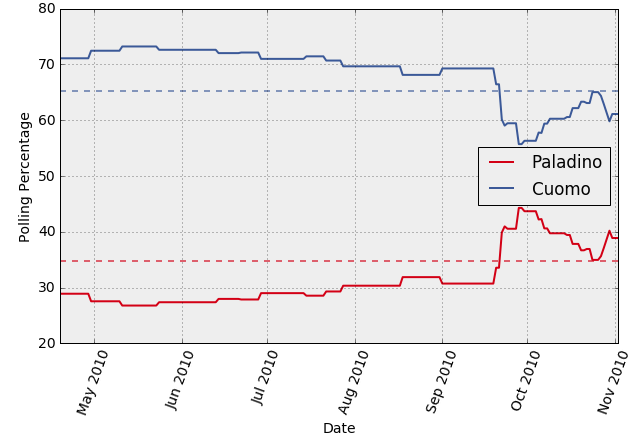
We can see that election polls generally seem to be within about 5% of the election outcome. The accuracy is higher shortly before the election (usually within 2% or so). In few cases, the eventual winner trails at some point during the last month of polling.
Data Aggregation*
Once we obtain the necessary data set and what it represents, we can aggregate the data, combine the historical poll data with the actual results, and compute the residual errors to be used for the predictive model later.
def error_data(url):
    """
    Given a Governor race URL, download the poll data and race result,
    and construct a DataFrame with the following columns:
    candidate: Name of the candidate
    forecast_length: Number of days before the election
    percentage: The percent of poll votes a candidate has.
                Normalized to that the canddidate percentages add to 100%
    error: Difference between percentage and actual race result
    The data are resampled as necessary, to provide one data point per day
    """

    id = id_from_url(url)
    xml = get_poll_xml(id)
    colors = plot_colors(xml)
    if len(colors) == 0:
        return pd.DataFrame()

    df = rcp_poll_data(xml)
    result = race_result(url)
    #remove non-letter characters from columns
    df = df.rename(columns={c: _strip(c) for c in df.columns})
    for k, v in result.items():
        result[_strip(k)] = v
    candidates = [c for c in df.columns if c is not 'date']

    #turn into a timeseries...
    df.index = df.date
    #...so that we can resample at regular, daily intervals
    df = df.resample('D')
    df = df.dropna()

    #compute forecast length in days
    #(assuming that last forecast happens on the day of the election, for simplicity)
    forecast_length = (df.index.max() - df.index).values
    forecast_length = forecast_length / np.timedelta64(1, 'D')  # convert to number of days

    #compute forecast error
    errors = {}
    normalized = {}
    poll_lead = {}

    for c in candidates:
        #turn raw percentage into percentage of poll votes
        corr = df[c].values / df[candidates].sum(axis=1).values * 100.
        err = corr - result[_strip(c)]
        normalized[c] = corr
        errors[c] = err

    n = forecast_length.size
    result = {}
    # np.hstack: stack arrays horizontally
    # np.repeat(c,n): create an array by repeating c for n times
    result['percentage'] = np.hstack(normalized[c] for c in candidates)
    result['error'] = np.hstack(errors[c] for c in candidates)
    result['candidate'] = np.hstack(np.repeat(c, n) for c in candidates)
    result['forecast_length'] = np.hstack(forecast_length for _ in candidates)

    result = pd.DataFrame(result)
    return result
"""
function
---------
all_error_data
Calls error_data on all races from find_governer_races(page),
and concatenates into a single DataFrame
"""

def all_error_data():
    url = 'http://www.realclearpolitics.com/epolls/2010/governor/2010_elections_governor_map.html'
    frames = list()
    for race in find_governor_races(url):
        df = error_data(race)
        if 'error' in df.columns:
            frames.append(df.error)
    df = pd.concat(frames, ignore_index=True)
    return df
Analysis
Once we aggregated data and computed the errors between poll data and actual results, we can now run the predictive model.
url = 'http://www.realclearpolitics.com/epolls/2010/governor/2010_elections_governor_map.html'
frames = list()
for race in find_governor_races(url):
    df = error_data(race)
    if 'error' in df.columns:
        frames.append(df.error)

errors = pd.concat(frames, ignore_index=True)
errors.hist(bins=50)
plt.xlabel("Polling Error")
plt.ylabel('N')

The histogram of the error shows that for large sample size, the error between the poll data and actual election results follows a normal distribution with mean near to zero. This indicates that poll records can be used as a predictor variable with certain residual error over large population. Also, it is important to note that the standard deviation of error is smaller for shorter period of forecasting length (i.e. the time period between the poll and the actual election day).
# errors for forecast_length more than 30 days
errors_30_days = errors[forecast_length>30]
errors_30_days.hist(bins=50)
plt.xlabel("Polling Error")
plt.ylabel('N')
sd = errors_30_days.std()
print(sd)

# errors for forecast_length less than 30 days
errors_7_days = errors[forecast_length<30]
errors_7_days.hist(bins=100)
plt.xlabel("Polling Error")
plt.ylabel('N')
sd = errors_7_days.std()
print(sd)

As showed above, the error between poll records and actual results has an expected mean close to zero and hence, could be used in predicting election results over large number of simulations. Here, I used basic bootstrap re-sampling to sample a random error residual.
"""
    Function
    --------
    get_poll_xml
    Given a poll_id, return the XML data as a text string
"""
def get_poll_xml(poll_id):
    url = "http://charts.realclearpolitics.com/charts/%i.xml" % int(poll_id)
    return requests.get(url).text
"""
    Function
    ---------
    bootstrap_result
    Extract the latest poll data of a governor race and run model multiple times
    Compute the probability that each governor wins over the simulation
    Parameters
    ----------
    url: str
        A string, containing the url of a governor race
    errors: list
        A list of errors between poll results and the actual rsults
        from the historical data
    nsample: int
        The number of simulation to run the model e.g. 1000, 10000
    Returns
    -------
    counts: dictionary
        A dictionary contains the probability each governor wins over the simulation
"""
def bootstrap_result(url, errors, nsample):
    id = id_from_url(url)
    xml = get_poll_xml(id)
    df = rcp_poll_data(xml)
    candidates = list()
    counts = dict()
    for column in df.columns:
        if column is not 'date':
            counts[column] = 0
            candidates.append(column)

    latest_poll_result = df.ix[df['date'].idxmax()].drop('date')
    latest_poll_result = 100.0*latest_poll_result/latest_poll_result.sum()
    print(latest_poll_result)
    for i in range(nsample):
        random = np.random.randint(len(errors))
        sample_error = errors[random]
        if (latest_poll_result[candidates[0]] + sample_error) > (latest_poll_result[candidates[1]] - sample_error):
            counts[candidates[0]] += 1
        else:
            counts[candidates[1]] += 1
    for candidate in candidates:
        counts[candidate] = counts[candidate]/float(nsample)
    return counts
As an example, we run the above model for these two governor races:
# 2013 Virginia Governor - Cuccinelli vs. McAuliffe
url1 = 'http://www.realclearpolitics.com/epolls/2013/governor/va/virginia_governor_cuccinelli_vs_mcauliffe-3033.html'
# 2013 New Jersey Governor - Christie vs. Buono
url2 = 'http://www.realclearpolitics.com/epolls/2013/governor/nj/new_jersey_governor_christie_vs_buono-3411.html'
nsample = 10000
result1 = bootstrap_result(url1, errors, nsample)
print(result1)
result2 = bootstrap_result(url2, errors, nsample)
print(result2)

According to this model, it is noted that in the 2013 Virginia Governor race, McAuliffe has more than 70% winning probability, while Cucccinelli has about 22% chance to win. In the 2013 New Jersey Governor race, Christie dominates the competition with more than 95% winning chance, much more than Buono’s rate. Both predicted results are in the same views with the latest poll results. Both McAuliffe and Christie won in the latest polls.
Now let’s look at an analysis of Clinton and Trump poll data to predict how much probability each can win the 2016 Presidential Election. The latest poll data is as of 3 August 2016.

With the same method, the model yields that out of 10000 simulations, Clinton has more than 80% chance to be the next U.S. President! What’s your guess??

Source: http://www.cnbc.com/2016/02/26/trump-vs-clinton-the-election-no-one-wants-commentary.html
Import the following libraries and functions for the code to run
# special IPython command to prepare the notebook for matplotlib
%matplotlib inline

from fnmatch import fnmatch
import numpy as np
import pandas as pd
import matplotlib.pyplot as plt
import requests
import bs4
from pattern import web

#these colors come from colorbrewer2.org. Each is an RGB triplet
dark2_colors = [(0.10588235294117647, 0.6196078431372549, 0.4666666666666667),
                (0.8509803921568627, 0.37254901960784315, 0.00784313725490196),
                (0.4588235294117647, 0.4392156862745098, 0.7019607843137254),
                (0.9058823529411765, 0.1607843137254902, 0.5411764705882353),
                (0.4, 0.6509803921568628, 0.11764705882352941),
                (0.9019607843137255, 0.6705882352941176, 0.00784313725490196),
                (0.6509803921568628, 0.4627450980392157, 0.11372549019607843),
                (0.4, 0.4, 0.4)]

rcParams['figure.figsize'] = (10, 6)
rcParams['figure.dpi'] = 150
rcParams['axes.color_cycle'] = dark2_colors
rcParams['lines.linewidth'] = 2
rcParams['axes.grid'] = True
rcParams['axes.facecolor'] = '#eeeeee'
rcParams['font.size'] = 14
rcParams['patch.edgecolor'] = 'none'
